

K-means clustering
#import libraries
import pandas as pd
import numpy as np
import matplotlib.pyplot as plt
import seaborn as sns
#create the dataframe
df=pd.read_csv("D:\income.csv")
print(df)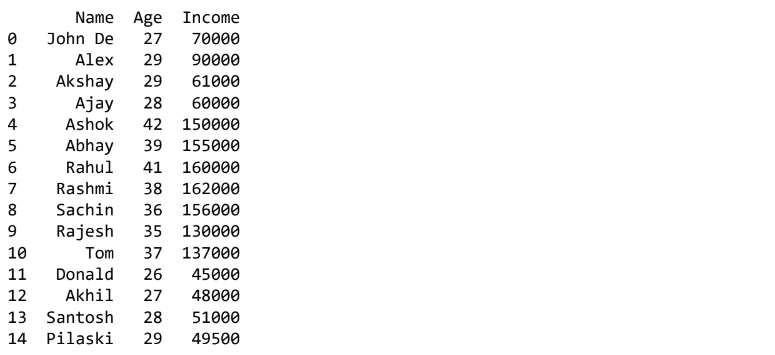
plt.scatter(df['Age'],df['Income'])
plt.xlabel('Age')
plt.ylabel('Income')
plt.show()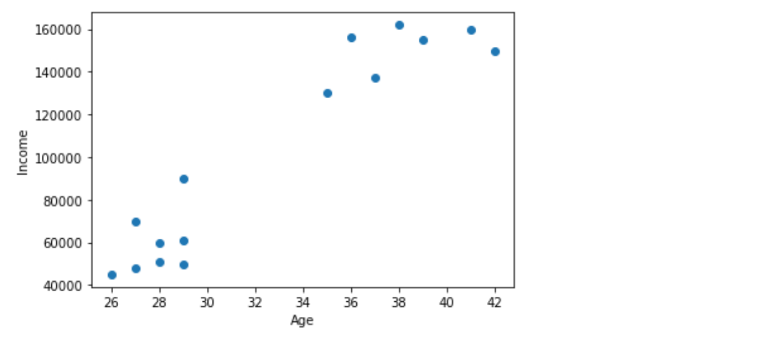
#Create Kmeans clustering model
from sklearn.cluster import KMeans
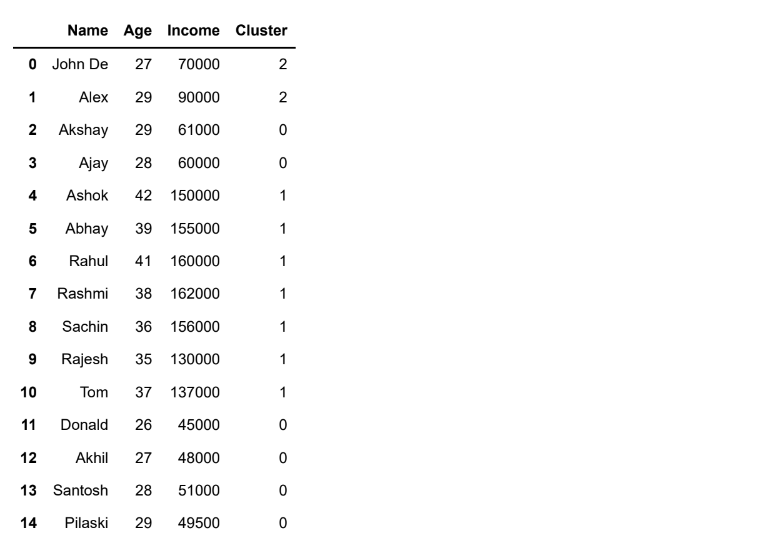
km=KMeans(n_clusters=3)y_predicted=km.fit_predict(df[['Age','Income']])
print(y_predicted)[2 2 0 0 1 1 1 1 1 1 1 0 0 0 0]
df['Cluster']=y_predicted
df
Output:
#To find the co-ordinates of each cluster
print(km.cluster_centers_)
[[2.78333333e+01 5.24166667e+04]
[3.82857143e+01 1.50000000e+05]
[2.80000000e+01 8.00000000e+04]]
X=km.cluster_centers_[:0]   #all rows in 0th column
Y=km.cluster_centers_[:1]              #all rows in 1st column
df1=df[df.Cluster==0]
df2=df[df.Cluster==1]
df3=df[df.Cluster==2]#scatter plot the clusters
plt.scatter(df1.Age,df1['Income'],color='green',marker='o')
plt.scatter(df2.Age,df2['Income'],color='red',marker='d')
plt.scatter(df3.Age,df3['Income'],color='black',marker='s')
#scatter plot the cluster centers also
#plt.scatter(X,Y,color='purple',marker='*',label='centroid')
#plt.legend()
plt.xlabel('Age')
plt.ylabel('Income')
plt.show()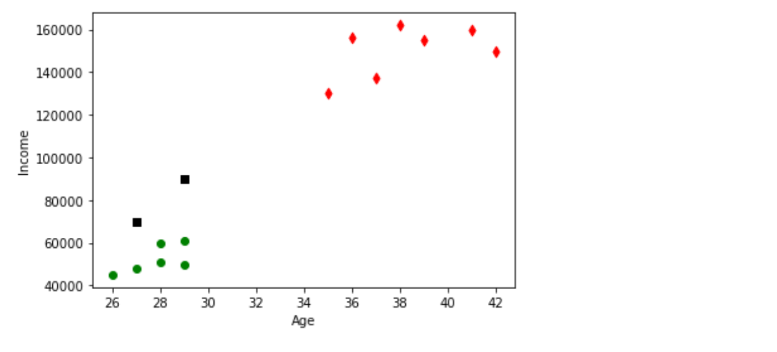
#Perofmr scaling opertaion using MinMaxScaler
from sklearn.preprocessing import MinMaxScaler
scaler=MinMaxScaler()
#scale up the Age column data
scaler.fit(df[['Age']])
df['Age']=scaler.transform(df[['Age']])#scale up the Income column data
scaler.fit(df[['Income']])
df['Income']=scaler.transform(df[['Income']])df.head()Output:

from sklearn.cluster import KMeans
km=KMeans(n_clusters=3)
y_predicted=km.fit_predict(df[['Age','Income']])
print(y_predicted)[0 0 0 0 2 2 2 2 1 1 1 0 0 0 0]
df['cluster']=y_predicted
df.head()
Output:
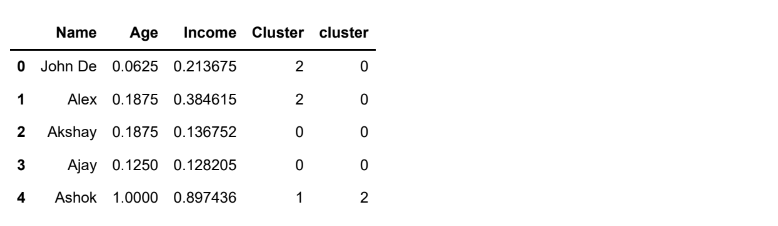
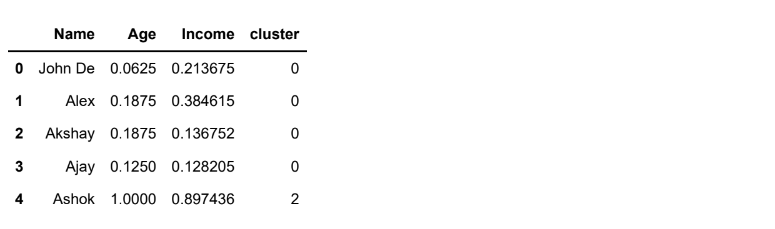
df.drop(columns='Cluster',axis=1,inplace=True)
df.head()
Output:
X=km.cluster_centers_[:0]      #all rows in 0th column
y=km.cluster_centers_[:1]                 #all rows in 1st column
df1=df[df.cluster==0]
df2=df[df.cluster==1]
df3=df[df.cluster==2]#scatter plot the clusters
plt.scatter(df1.Age,df1['Income'],color='green',marker='o')
plt.scatter(df2.Age,df2['Income'],color='red',marker='d')
plt.scatter(df3.Age,df3['Income'],color='black',marker='s')
#scatter plot the cluster centers also
#plt.scatter(X,y,color='purple',marker='*',label='centroid')
#plt.legend()
plt.xlabel('Age')
plt.ylabel('Income')
plt.show()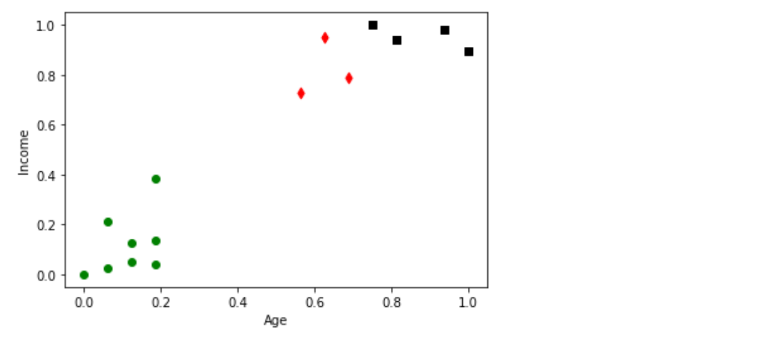
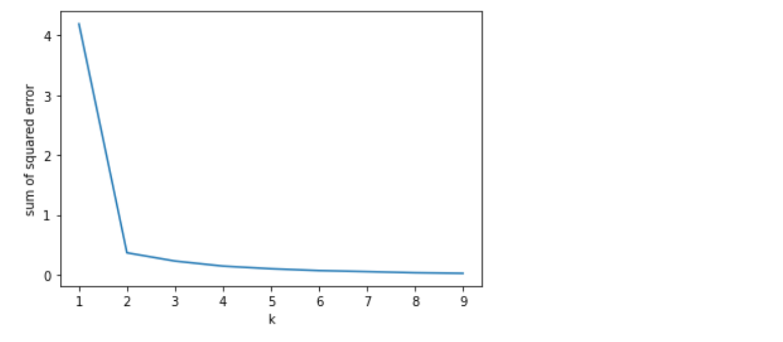
#Elbow plot
sse=[] #empty list
k_rng=range(1,10) #k changes from 1 to 9
sse=[]
k_rng=range(1,10)
for k in k_rng:
km=KMeans(n_clusters=k)
km.fit(df[['Age','Income']])
sse.append(km.inertia_)
#print(sse)
plt.xlabel('k')
plt.ylabel('sum of squared error')
plt.plot(k_rng,sse)
plt.show()C:\Users\javab\anaconda3\lib\site-packages\sklearn\cluster\_kmeans.py: 1036: UserWarning: KMeans is known to have a memory leak on Windows with MKL, when there are less chunks than available threads. You can avoid it by setting the environment variable OMP_NUM_THREADS=1.warnings.warn(
About the Author

Silan Software is one of the India's leading provider of offline & online training for Java, Python, AI (Machine Learning, Deep Learning), Data Science, Software Development & many more emerging Technologies.
We provide Academic Training || Industrial Training || Corporate Training || Internship || Java || Python || AI using Python || Data Science etc


PreviousNext
Join our newsletter for the latest updates.
About us
Our Services
Contact Us
Our Courses
Learn Python | Learn AI | Learn Machine Learning | Learn Deep Learning | Learn Core Java | Learn Java JSP | Learn Java Servlet | Learn Java Spring Core | Learn Spring Boot | Learn Power BI | Learn DAA | Learn HTML | Learn SQL | Learn C Programming | Learn Bootstrap | Learn Git | Learn JavaScript | Learn Data Structure Using C | Learn RDBMS | Learn Data Science | Learn PHP
Our Tutorials
Python Tutorial | AI Tutorial | Machine Learning Tutorial | Deep Learning Tutorial | Core Java Tutorial | Java JSP Tutorial | Java Servlet Tutorial | Java Spring Tutorial | Spring Boot Tutorial | Power BI Tutorial | DAA Tutorial | HTML Tutorial | SQL Tutorial | C Programming Tutorial | Bootstrap Tutorial | Git Tutorial | JavaScript Tutorial | Data Structure Using C Tutorial | RDBMS Tutorial | Data Science Tutorial | PHP Tutorial
Copyright © 2023 Pythontpoint Powered by Silan Software Pvt. Ltd. All rights reserved.