

Tree Map
Tree Map:
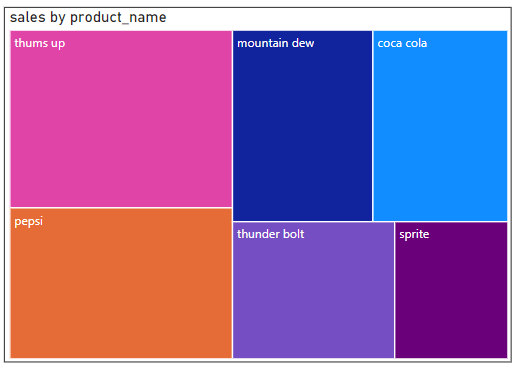
In this type of chart, we can easily visualize the data that is grouped in a hierarchical structure.
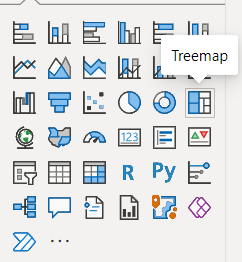
The location of the tree map in Power BI window is here:
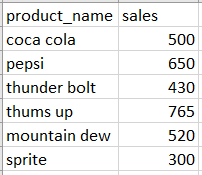
Example Dataset:
Now the plot:
About the Author

Silan Software is one of the India's leading provider of offline & online training for Java, Python, AI (Machine Learning, Deep Learning), Data Science, Software Development & many more emerging Technologies.
We provide Academic Training || Industrial Training || Corporate Training || Internship || Java || Python || AI using Python || Data Science etc


PreviousNext
Join our newsletter for the latest updates.
About us
Our Services
Contact Us
Our Courses
Learn Python | Learn AI | Learn Machine Learning | Learn Deep Learning | Learn Core Java | Learn Java JSP | Learn Java Servlet | Learn Java Spring Core | Learn Spring Boot | Learn Power BI | Learn DAA | Learn HTML | Learn SQL | Learn C Programming | Learn Bootstrap | Learn Git | Learn JavaScript | Learn Data Structure Using C | Learn RDBMS | Learn Data Science | Learn PHP
Our Tutorials
Python Tutorial | AI Tutorial | Machine Learning Tutorial | Deep Learning Tutorial | Core Java Tutorial | Java JSP Tutorial | Java Servlet Tutorial | Java Spring Tutorial | Spring Boot Tutorial | Power BI Tutorial | DAA Tutorial | HTML Tutorial | SQL Tutorial | C Programming Tutorial | Bootstrap Tutorial | Git Tutorial | JavaScript Tutorial | Data Structure Using C Tutorial | RDBMS Tutorial | Data Science Tutorial | PHP Tutorial
Copyright © 2023 Pythontpoint Powered by Silan Software Pvt. Ltd. All rights reserved.