

Python Matplotlib Tutorial
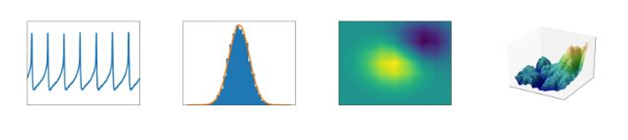
Python matplotlib is a plotting library specifically used to generate 2D or 3D plots. The main advantage is data visualization. So matplotlib is a comprehensive library for creating static, animated, and interactive visualizations in Python.
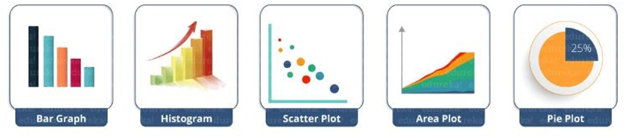
Python Matplotlib : Types of Plots
There are varieties of plots that we can create using python matplotlib like bar graph, histogram, scatter plot, area plot, pie plot etc .
Now we will see how to generate a graph by executing basic codes in python matplotlib.
#import pyplot(pyplot is a sub module of matplotlib)
import matplotlib.pyplot as plt
#import matplotlib
import matplotlib
#To get the current version of matplotlib
print(matplotlib.__version__)
3.3.2
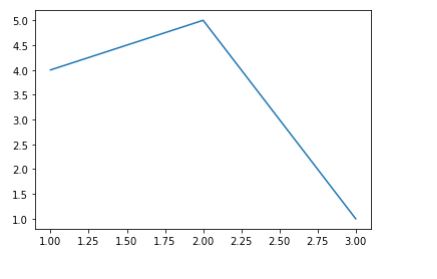
#Create a 2Dplot
plt.plot([1,2,3],[4,5,1])
plt.show()
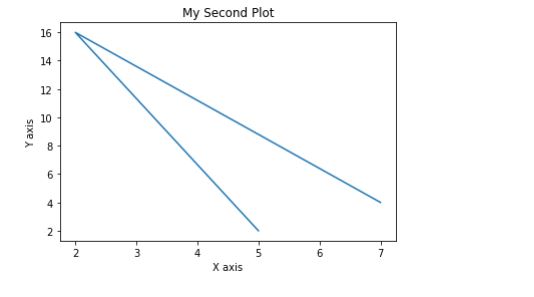
#Create another plot
x = [5,2,7]
y = [2,16,4]
plt.plot(x,y)
plt.title('My Second Plot')
plt.ylabel('Y axis')
plt.xlabel('X axis')
plt.show()
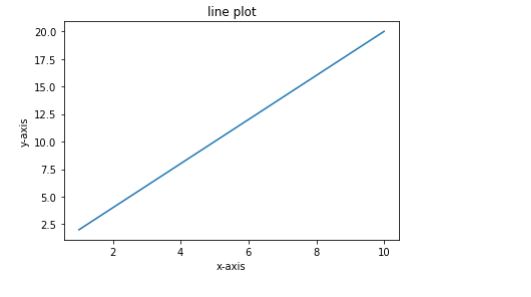
#Create a Line plot
import numpy as np
x=np.arange(1,11)
print(x)
[ 1 2 3 4 5 6 7 8 9 10]
y=2 * x
print(y)
[ 2 4 6 8 10 12 14 16 18 20]
plt.plot(x,y)

plt.title("line plot")
plt.xlabel("x-axis")
plt.ylabel("y-axis")
plt.show()
x
Output:
array([ 1, 2, 3, 4, 5, 6, 7, 8, 9, 10])
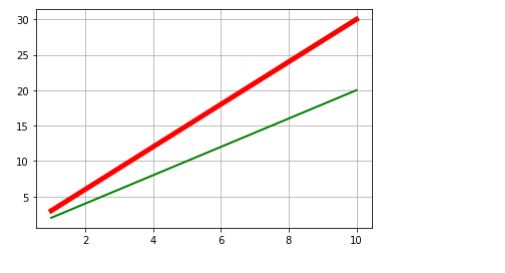
y1=2*x
y2=3*x

print(y1)
print(y2)
[ 2 4 6 8 10 12 14 16 18 20]
[ 3 6 9 12 15 18 21 24 27 30]
plt.plot(x,y1,color="g",linewidth=2)
plt.plot(x,y2,color="r",linewidth=5)

plt.grid(True)
plt.show()
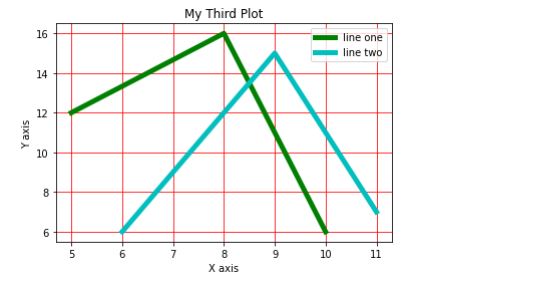
#Create multi-line plot
x = [5,8,10]
y = [12,16,6]

x2 = [6,9,11]
y2 = [6,15,7]

plt.plot(x,y,'g',label='line one', linewidth=5)
plt.plot(x2,y2,'c',label='line two',linewidth=5)

plt.title('My Third Plot')
plt.ylabel('Y axis')
plt.xlabel('X axis')

plt.legend()
plt.grid(True,color='r')

plt.show()
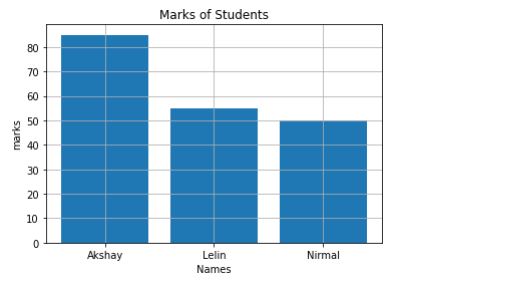
#Bar Graph plot
student={"Akshay":85,"Lelin":55,"Nirmal":50}
names=list(student.keys())
marks=list(student.values())

print(names)
print(marks)
['Akshay', 'Lelin', 'Nirmal']
[85, 55, 50]
plt.bar(names,marks)

plt.title("Marks of Students")
plt.xlabel("Names")
plt.ylabel("marks")
plt.grid(True)
plt.show()
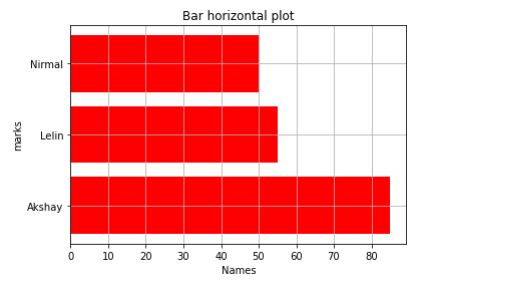
plt.barh(names,marks,color="r")
plt.title("Bar horizontal plot")
plt.xlabel("Names")
plt.ylabel("marks")
plt.grid(True)
plt.show()
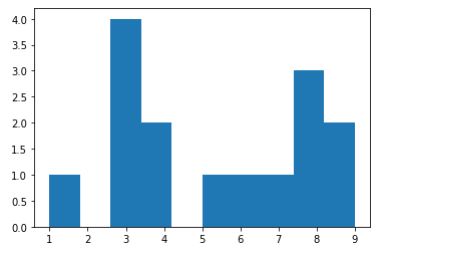
#Histogram plot
data=[1,3,3,3,3,9,9,5,4,4,8,8,8,6,7]
plt.hist(data)
plt.show()
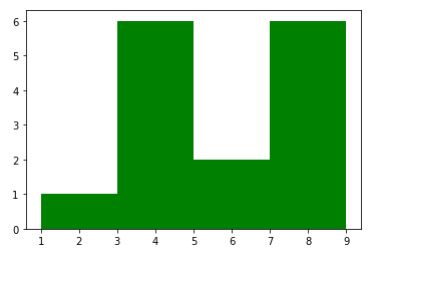
plt.hist(data,color="g",bins=4)
plt.show()
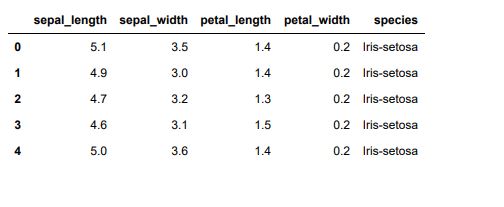
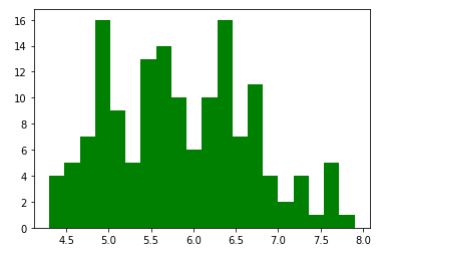
#Create histogram by taking iris dataset
import pandas as pd
iris=pd.read_csv("iris.csv")
iris.head()
plt.hist(iris['sepal_length'],bins=20,color='g')
plt.show()
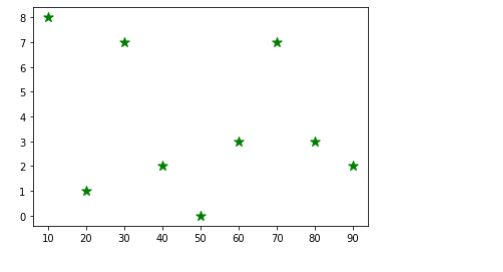
#Scatter Plot
x=[10,20,30,40,50,60,70,80,90]
y=[8,1,7,2,0,3,7,3,2]

plt.scatter(x,y, marker='*',c='g',s=100)
plt.show()
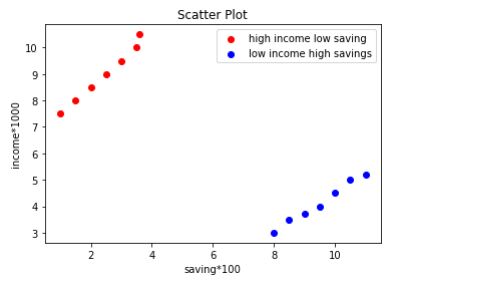
#Create a scatter plot
x = [1,1.5,2,2.5,3,3.5,3.6]
y = [7.5,8,8.5,9,9.5,10,10.5]

x1=[8,8.5,9,9.5,10,10.5,11]
y1=[3,3.5,3.7,4,4.5,5,5.2]

plt.scatter(x,y, label='high income low saving',color='r')
plt.scatter(x1,y1,label='low income high savings',color='b')

plt.xlabel('saving*100')
plt.ylabel('income*1000')
plt.title('Scatter Plot')

plt.legend()

plt.show()
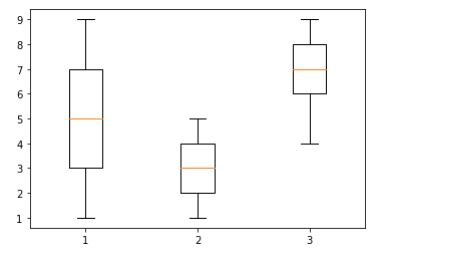
#Create Box Plot
one=[1,2,3,4,5,6,7,8,9]
two=[1,2,3,4,5,4,3,2,1]
three=[6,7,8,9,8,7,6,5,4]

data=list([one,two,three])
plt.boxplot(data)
plt.show()
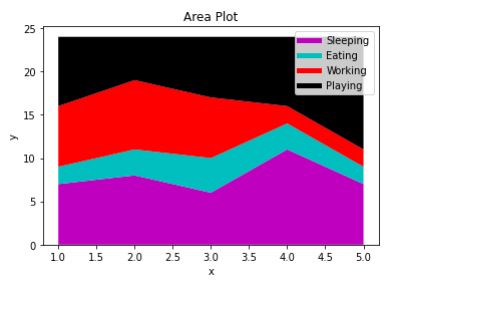
#Create area plot
days = [1,2,3,4,5]

sleeping =[7,8,6,11,7]
eating = [2,3,4,3,2]
working =[7,8,7,2,2]
playing = [8,5,7,8,13]

plt.plot([],[],color='m', label='Sleeping', linewidth=5)
plt.plot([],[],color='c', label='Eating', linewidth=5)
plt.plot([],[],color='r', label='Working', linewidth=5)
plt.plot([],[],color='k', label='Playing', linewidth=5)

plt.stackplot(days, sleeping,eating,working,playing, colors=['m','c','r','k'])

plt.xlabel('x')
plt.ylabel('y')
plt.title('Area Plot')
plt.legend()
plt.show()
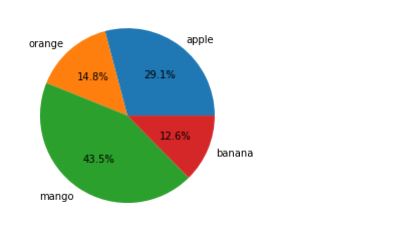
#Pie plot
fruit=['apple','orange','mango','banana']
quantity=[67,34,100,29]
plt.pie(quantity,labels=fruit,autopct='%1.1f%%')
plt.show()
About the Author

Silan Software is one of the India's leading provider of offline & online training for Java, Python, AI (Machine Learning, Deep Learning), Data Science, Software Development & many more emerging Technologies.
We provide Academic Training || Industrial Training || Corporate Training || Internship || Java || Python || AI using Python || Data Science etc


PreviousNext
Join our newsletter for the latest updates.
About us
Our Services
Contact Us
Our Courses
Learn Python | Learn AI | Learn Machine Learning | Learn Deep Learning | Learn Core Java | Learn Java JSP | Learn Java Servlet | Learn Java Spring Core | Learn Spring Boot | Learn Power BI | Learn DAA | Learn HTML | Learn SQL | Learn C Programming | Learn Bootstrap | Learn Git | Learn JavaScript | Learn Data Structure Using C | Learn RDBMS | Learn Data Science | Learn PHP
Our Tutorials
Python Tutorial | AI Tutorial | Machine Learning Tutorial | Deep Learning Tutorial | Core Java Tutorial | Java JSP Tutorial | Java Servlet Tutorial | Java Spring Tutorial | Spring Boot Tutorial | Power BI Tutorial | DAA Tutorial | HTML Tutorial | SQL Tutorial | C Programming Tutorial | Bootstrap Tutorial | Git Tutorial | JavaScript Tutorial | Data Structure Using C Tutorial | RDBMS Tutorial | Data Science Tutorial | PHP Tutorial
Copyright © 2023 Pythontpoint Powered by Silan Software Pvt. Ltd. All rights reserved.